
At Zenlytic, we’re committed to making data storytelling as intuitive and powerful as possible. This week, we’re excited to announce a significant upgrade to Zoë, our AI data coworker. She now has enhanced control over the plots she generates, offering you greater flexibility and precision in your data visualizations.Take a look at Paul’s LinkedIn here.
Enhanced Plot Customization
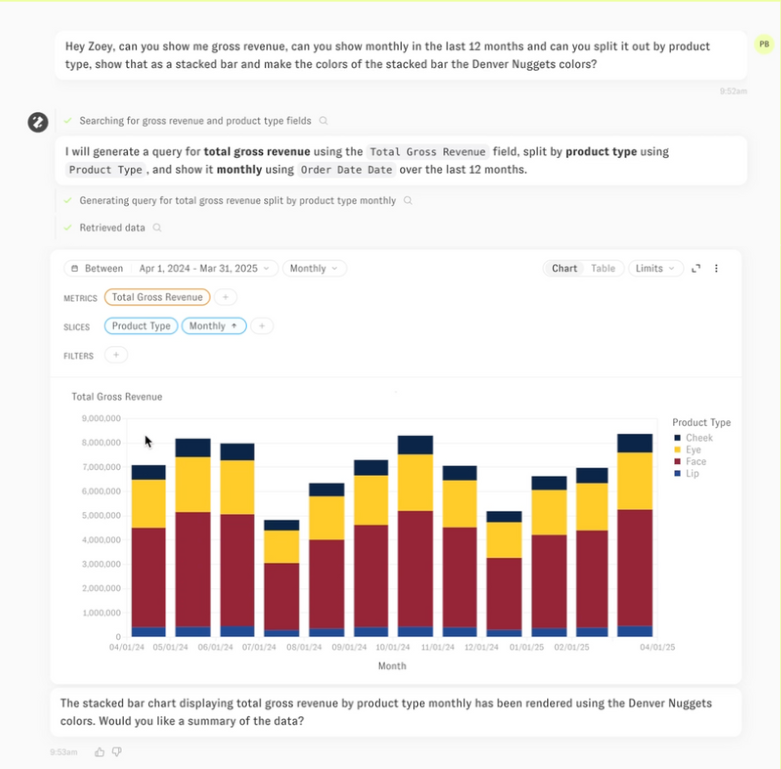
Zoë can now interpret more nuanced requests, allowing for highly customized visualizations. For example, you can ask:
“Show me gross revenue by product type over the last 12 months as a stacked bar chart using Denver Nuggets colors.”
Zoë will deliver exactly that—tailored to your specifications.
More Intelligence, Less Constraint
Previously, Zoë’s plotting capabilities were limited to predefined UI controls. With this update, she can add features beyond the standard graphical interface, enabling more sophisticated and customized visualizations.
Why This Matters for AI and BI Professionals
For professionals in the AI and BI space, this enhancement means:
- Greater Flexibility: Customize visual elements to match specific branding or presentation needs.
- Improved Efficiency: Reduce the time spent tweaking visuals manually.
- Enhanced Storytelling: Deliver more impactful data narratives with visuals that resonate.
See Zoë in Action
Watch this quick demo to see Zoë’s new plotting capabilities: