

Picture your team pulling up 3 different revenue numbers for the same SKU. One comes from the retailer portal, another from the trade system, and the third from last week’s dashboard.
Mismatches such as these cost your team hours every week, and they make everyone on your team lose trust in every report that follows.
Your point-of-sale, trade, and supply chain data keeps piling up, yet turning it into an answer you can act on remains hard.
In today’s guide, we break down the best CPG data analytics tools and how to pick the right fit for your commercial team.
TL;DR: 5 Best CPG Data Analytics Tools
Here’s a quick snapshot of the 5 platforms we’ll cover.
What Is CPG Data Analytics?
CPG data analytics is the practice of turning your scattered retail, trade, and supply chain data into decisions you can act on.
Software platforms built for this work help your sales team prepare for buyer meetings, your trade marketers prove ROI from promotions, and your category managers defend shelf space.
Without a shared platform, your teams pull numbers from a dozen portals and spreadsheets, then argue over whose version is right.
You need a strong CPG analytics tool to turn your trade expenditure budget into a measured investment.

Key CPG Data Sources Every Analytics Tool Must Handle
Your preferred platform can only answer questions as well as the data feeding it. Your team draws from a broader mix of CPG data sources, and each adds context that the others can’t.
- Point-of-Sale Data: Scanner data from every retailer shows you what actually sold, at what price, and on what day.
- Syndicated Data: Panel providers add market share and competitor pricing context that your internal sales figures alone can’t show.
- Direct-to-Consumer and Loyalty Data: First-party purchase history and loyalty activity provide the behavioral detail that retailer data leaves out.
- Trade and Promotion Systems: Your deduction records, accrual data, and promotion calendars reveal where your trade dollars actually went.
- Supply Chain and ERP Feeds: Inventory levels, production schedules, and distributor orders connect demand to what you can ship.
Top 5 CPG Data Analytics Solutions
Here’s a detailed discussion of the 5 tools.
1. Zenlytic: Best For Trusted Answers On Trade And Retail Data
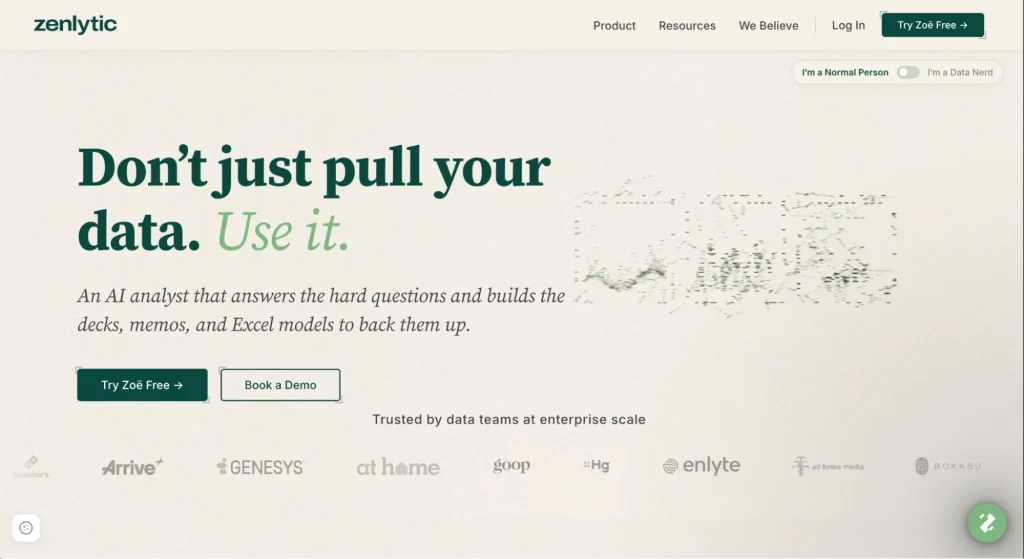
Zenlytic gives your CPG commercial team an AI data analyst purpose-built for consumer packaged goods, a different starting point than a generic BI tool with AI features bolted on.
Zoë, the AI data analytics agent at the center of the platform, reads your point-of-sale, trade, and supply chain data and answers your questions in plain English.
You can ask her why a promotion underperformed in one region, and she returns a detailed breakdown of lift, distribution, and pricing in seconds, without requiring you to write any SQL.
Here’s what makes her answers reliable:
- Every Number Traces Back To Its Source: Zoë shows you the table, filter, and calculation behind every figure through Citations. You can confirm answers and numbers in seconds and move on.
- Ease of Set Up in Under an Hour: On first connection, Zoë reads your existing dashboards, SQL queries, and dbt models to understand how your team already works with data. You don’t have to set things manually.
- Consistent Answers and Metrics: Definitions such as revenue, lift, and margin live in one place in the Clarity Engine, and Zoë applies all your governed metrics and business definitions to every question she answers. A category manager in one region and a trade marketer in another ask the same question and get identical numbers back.
- Board-Ready Deliverables: Zoë’s analysis comes in the form of Artifacts, such as decks or Excel models that update automatically as new data arrives. Your team no longer has to rebuild the same report every Monday.
Kelly Murphy, VP of Direct to Consumer and Amazon at LOLA, captures the experience:
“I definitely needed a self-service business intelligence tool that can provide me with all of the data that I need. Zenlytic has been a great resource and has been there when we need them.”
Ready to see how an analytics agent handles your own trade and retail data?
See Zoë in action using your own data.
2. ThoughtSpot: Best For Search-Driven Self-Service

ThoughtSpot is a search-based analytics platform built around natural language queries. Your category and trade teams can type a question into a search bar and get a chart back.
Its Spotter AI agent layers natural language summaries on top of that search experience, and the platform embeds well in retailer-facing portals.
You get the most out of ThoughtSpot when your questions map cleanly to tables your IT team has already modeled. As such, multi-step questions that blend trade, supply chain, and point-of-sale data often require additional setup in ThoughtSpot.
3. Power BI: Best For Microsoft-Native Enterprises
As Microsoft’s business intelligence platform, Power BI brings together an Excel-style report builder and Microsoft’s Copilot, the AI assistant that summarizes your report data in plain, natural language.
If your CPG enterprise already operates on Dynamics and Azure, that native fit keeps licensing and training costs low.
Power BI works best when your data team has already built the reports that Copilot summarizes. Any ad hoc trade questions that fall outside an existing Power BI report usually go back to an analyst before anyone gets an answer.
4. Tableau: Best For Visual, Drag-And-Drop Dashboards

Tableau, which is now part of Salesforce, turns raw data into highly customizable, drag-and-drop dashboards your marketing and category teams can use to spot trends visually.
Tableau Agent, its newer AI layer, adds natural-language summaries and chart suggestions to an existing workbook.
You get the most value once an analyst has already built the dashboard your category manager needs. An unplanned follow-up question typically means Tableau needs a dashboard update before anyone gets an answer.
5. Databricks Genie: Best For Lakehouse-Native Demand Forecasting
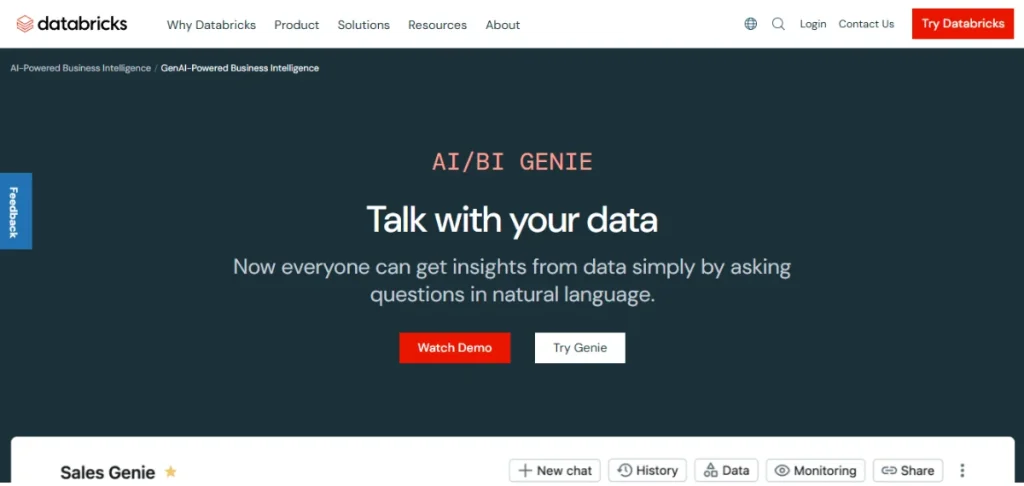
As Databricks’ natural language interface, Databricks AI-BI Genie lets your business users query tables stored directly in a Databricks lakehouse without writing SQL.
Your data team configures Genie Spaces around a specific use case, such as demand forecasting, with sample queries and column-level synonyms.
Genie works best when your CPG organization already operates its forecasting models on Databricks and wants a lighter query layer on top. If a question exceeds a Space’s saved examples, you have to call a data engineer to expand the scope.
Criteria for Choosing a CPG Analytics Software
When choosing from the above tools, you must look beyond the feature list, which only tells part of the story. Here’s a simple way you can use to score each platform on the same terms.
None of these criteria matters on its own. A platform that scores well on trust but takes 6 months to set up still leaves your team waiting for the plain-language answers they need from your CPG data.
CPG Analytics Use Cases by Business Function
The right analytics tool should provide consistent answers, even when different functions within your organization ask the same question.
Your CPG team, whether it works in retail, technology-enabled commercial operations, or manufacturing, tends to lean on the following recurring functions.
- Trade Marketing: Your trade team can measure your business’s incremental lift based on the promotion type and retailer, then reallocate next quarter’s budget to activities that actually move your product.
- DTC and Marketing: Your marketing leads can connect CPG marketing analytics to campaign spend, tying loyalty and e-commerce behavior back to specific launches.
- Retail Execution: Your field and commercial teams can track compliance against planograms and your distribution targets across hundreds or thousands of stores.
- Supply Chain and Operations: Your planners can use CPG data to reconcile demand signals with production capacity, which helps you maintain high service levels.
CPG Analytics Best Practices
Once you choose the best platform for all your use cases, you must follow common best practices to keep its output clean to encourage organization-wide adoption.
Below are key steps you can take.
- Connect Point-of-Sale First: Every other metric your platform calculates depends on accurate sell-through data. You must get that feed stable before you layer on trade or supply chain sources.
- Define Metrics Once: Agree on how your business defines and calculates metrics such as revenue, lift, and margin, then apply those definitions and calculations across the platform for every team. Your teams will stop arguing over whose number is right once the logic lives in one place.
- Review Performance Regularly: Stop waiting until the quarter ends to check whether a promotion worked because doing so will waste the window your platform gives you to adjust things. Feed your platform clean, well-defined data so it can give answers you can trust within seconds, while you still have enough room to correct things early.

Frequently Asked Questions (FAQs)
Here are direct answers to the questions CPG teams ask most when evaluating an analytics platform.
What Data Sources Do CPG Analytics Tools Use?
CPG analytics tools draw their data sources mainly from point-of-sale scanner data, syndicated panel data, trade and promotion systems, and supply chain or ERP feeds. Many brands also add direct-to-consumer and loyalty data, giving you a full view of sell-through, margin, and demand across every channel you sell in.
What Is the Difference Between a CPG Analytics Tool and a BI Tool?
A BI tool visualizes data you already know how to query. A CPG analytics tool understands trade spend, baseline lift, and distributor sell-in from day one, and your business users get a usable answer without building a report from scratch.
How Do CPG Brands Use Analytics to Improve Trade Promotion ROI?
Like other CPG brands, you can improve trade promotion ROI by measuring your incremental lift against the modeled baseline you build from historical sell-through. The comparison reveals which discounts, displays, and retailer combinations generate real volume, and which simply move purchases forward in time or erode margins.
What Should CPG Teams Look for in an Analytics Tool?
You’ll want a platform that handles manufacturer-specific data, explains its logic in plain language, and lets your non-technical staff ask follow-up questions on their own. Governance matters as well because every team needs to trust the answer, no matter who pulls it.
Conclusion
To choose the best CPG data analytics tool, you have to answer one critical question first: Can your team trust the tool’s answers and metrics enough to act on them today?
While still important for some use cases, search-based tools, Microsoft’s ecosystem play, visual dashboards, and lakehouse-native agents only solve a piece of what your commercial team needs.
Zoë, the analytics agent, takes the solution further by combining cited, governed answers, board-ready output, and a self-onboarding setup that wraps up under an hour.
See how Zoë can deliver trustworthy answers from your CPG data.